Blog.SSHKit.com — How to Monitor Processes on Linux Using htop. Htop is a command-based utility that monitors real-time system resources or processes on your Linux system. In this tutorial, we will discuss how to install, use and briefly explain the function of each menu on htop.
Monitoring Processes on Linux With htop
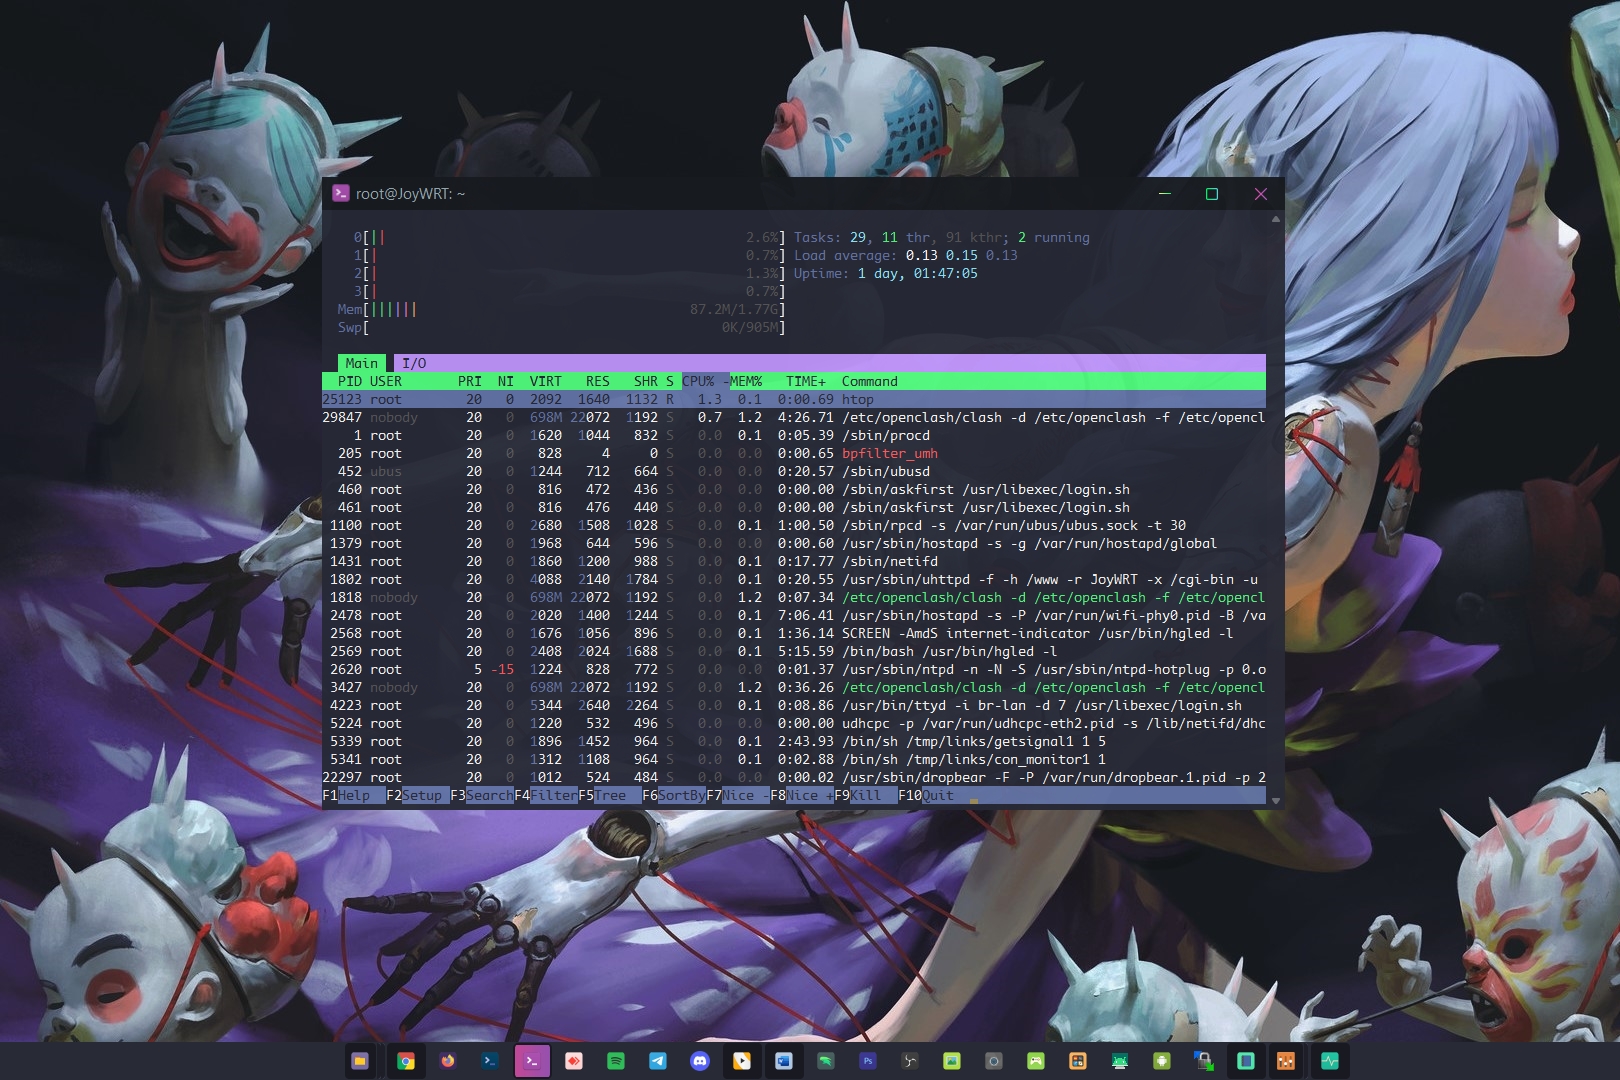
After htop is installed, please open a terminal or SSH then type the command htop then enter. Then the results of the command will appear as shown below:
The results above can be divided into 3 parts to make them easier to understand.
Header
The top left is the CPU and Memory (RAM) usage information. The top right gives us information about Load Average and Uptime. Other information contains real-time process data with statistics like a priority, CPU consumption, RAM or Memory, etc.
For further discussion, you can see below.
CPU
Starting from the top left, there is a CPU line showing the percentage of CPU being used. For Single-core CPU, there will only be one line, but if Multi-Core there will be several lines.
You can see the percentage in percent, the higher the CPU has a lot of loads. Several colors indicate CPU usage, including:
- Red = Kernel Process
- Green = Normal user process
- Blue = Low priority process
Memory (RAM)
The next line shows the memory usage consumed by the process running on Linux which is indicated by the amount of memory used from the total memory.
There are several color codes on the memory line, including:
- Green: Memory page usage
- Blue: buffer on pages
- Yellow: memory cache usage
Load Average
Next, we shift to the top-right menu, namely load average. This menu is the average calculation of the process used by each core on the CPU.
The usage average contains three values. The first number is the average CPU usage in one minute (0.07 in the image above), the second number is the average 5 minutes (0.13), and the third is the average CPU usage in 15 minutes (0.09 in the image above).
Process Information (Body)
This menu will show the processes running on Linux.
As the image above shows, several lines are described as follows:
- PID: ID Proses.
- USER: Username.
- VIRT: Virtual memory used by processes
- %CPU: Percentage of processor time used by the process.
- %MEM: Percentage of physical RAM used by processes.
- COMMAND: The name of the command or process.
Footer
The Footer menu on htop contains commands in the menu that you can click or press each hotkey.
Each menu has its own function. For example, you can use F6 Sort By to sort processes by their CPU or Memory (RAM) usage.
Or you can use F3 Search to search for a specific process.
Conclusion
In short, htop is a command line that you can use to monitor processes running on your Linux. This is similar to the Task Manager in Windows. You can use htop to search for processes that might be causing your system to slow down.


![[Blog SSHKIT] Change New Folder Name](https://blog.sshkit.com/wp-content/uploads/2021/12/Blog-SSHKIT-Change-New-Folder-Name.png)
![[Blog HAX] Install XDM](https://blog.sshkit.com/wp-content/uploads/2021/11/Blog-HAX-Install-XDM.png)